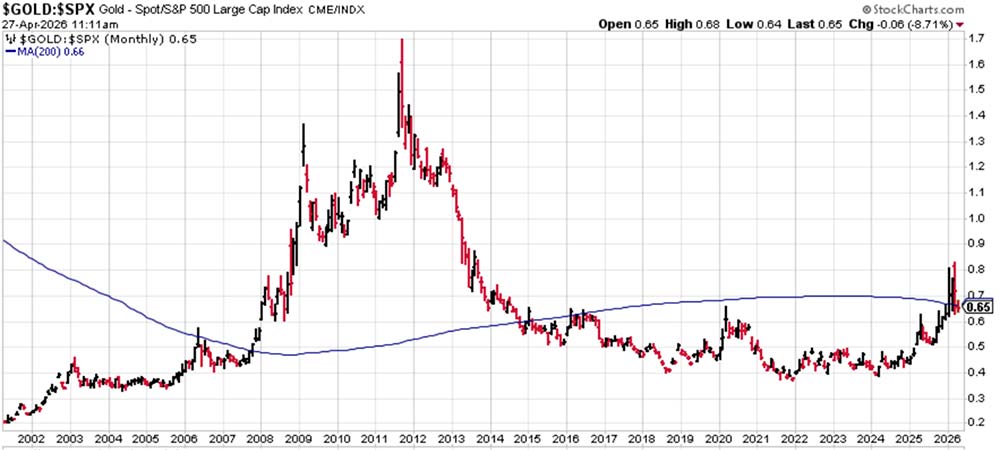
 Right now, gold is trading at 0.65 times the price of the S&P 500. It appears to be emerging from a 10-year base. It is also sitting right at the 200-month moving average. A sustained break above that level would suggest gold prices are likely to accelerate versus the S&P. That doesn’t necessarily mean that gold goes up and the S&P goes down. I’m bullish on stocks, so if the index continues to rise (as we know it does over the long term) and gold narrows the gap between it and the S&P 500, gold prices will climb significantly. For the short term, let’s look at a daily chart over the past year.
 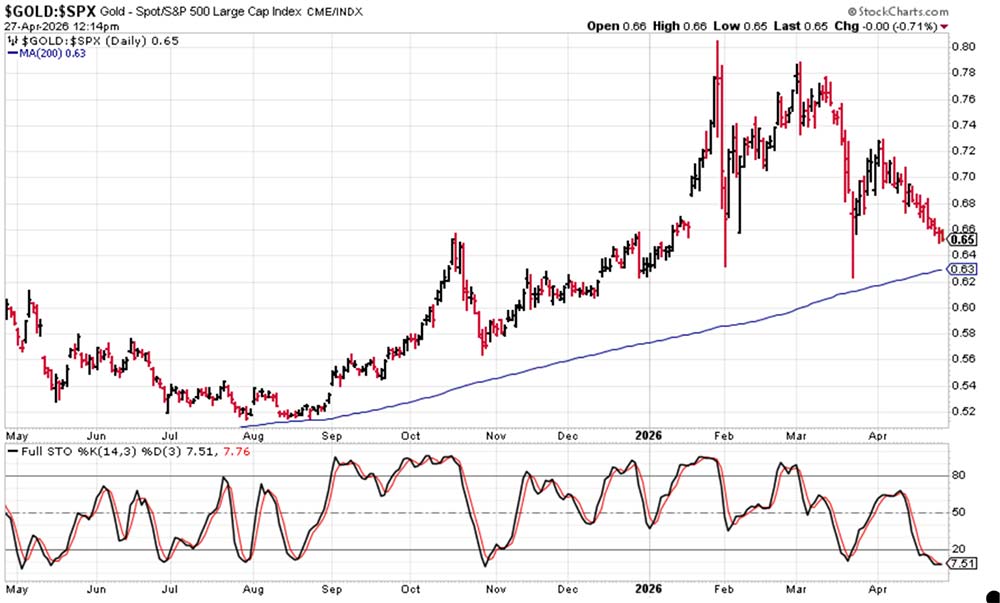 The ratio has been falling since January as gold has come off its highs. It’s getting very close to the rising 200-day moving average, which should act as support. Additionally, the bottom panel is a stochastics indicator, which measures momentum. It is very oversold and starting to turn higher. That’s a bullish signal. If this were a stock, I’d be eager to buy it, as it is in an uptrend and coming into support with momentum starting to shift. Once gold makes its next move higher, if the ratio gets through the 200-month moving average, I wouldn’t be surprised if it moves closer to 1.0, which would mean the price of gold would be in line with the S&P 500. Even if the S&P didn’t budge from current levels, that would suggest a 56% increase in the price of gold. And if the S&P continues to rise, the gain in gold would be even higher. There are a lot of reasons to like gold right now. Its relationship to stocks is another one. The post Is Gold Undervalued in 2026? appeared first on Wealthy Retirement.
 Source: https://wealthyretirement.com/market-tr ... source=app